Details
Languages
English
Grade
6th, 7th, 8th, 9th
Resource Type
Activities, Assignments, Worksheets
Product
Digital
Pages
2 Pages
Subject
Science, Earth Science, Environment & Ecology
Standard
Not standard specific
Description
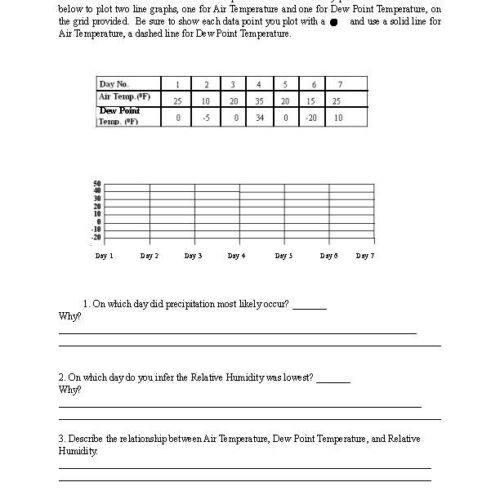
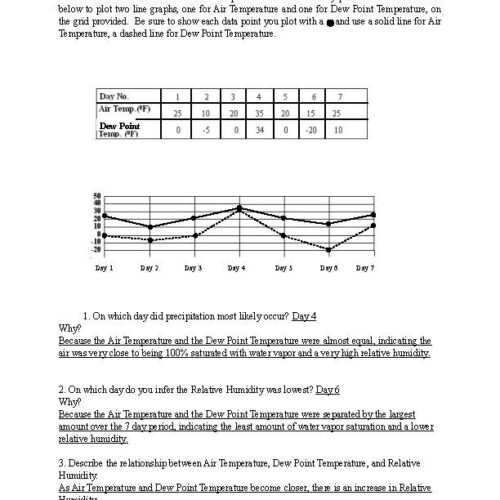
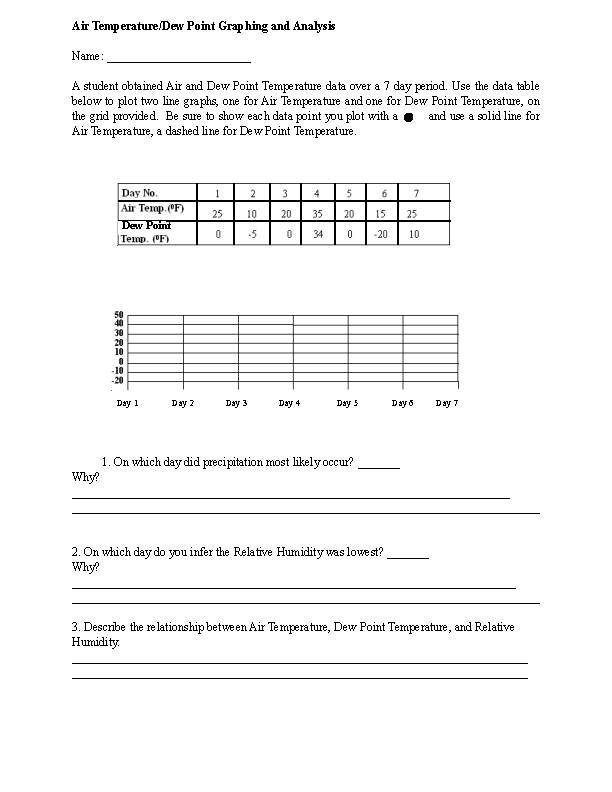
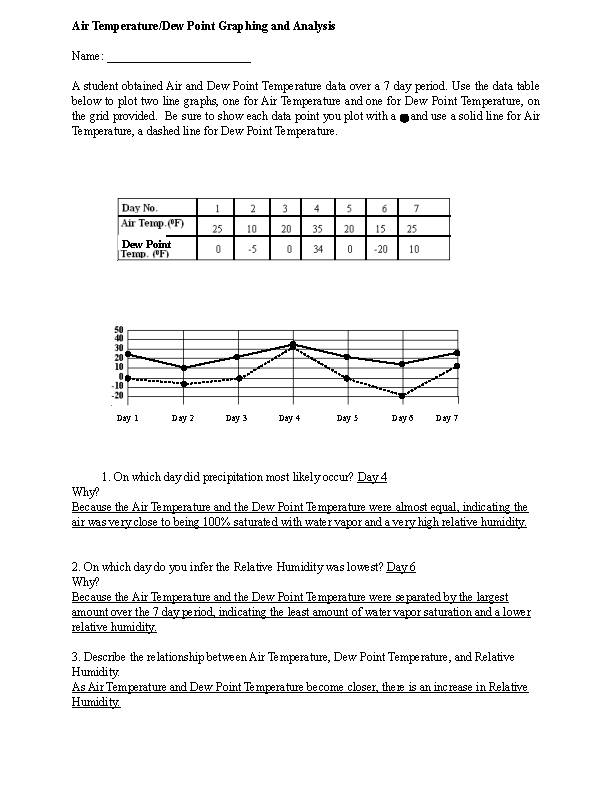
This worksheet involves graphing Air Temperature and Dew Point Temperature over a 7 day period. The graph reveals the days when the two variables are close together and further apart. The student is asked what day precipitation likely occurs, when the Relative Humidity was highest, and the relationship between the variables.
This worksheet involves graphing Air Temperature and Dew Point Temperature over a 7 day period. The graph reveals the days when the two variables are close together and further apart. The student is asked what day precipitation likely occurs, when... more

Reviews
More from this shop


Similar items