Details
Watch Time
30 Minutes
Subject
Math, Graphs & Charts, Probability and statistics
Product
Digital
Grade
10th, 11th, 12th, Adult Ed
Resource Type
Activities, Assignments, Computation
Description
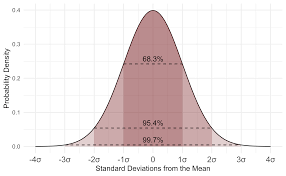
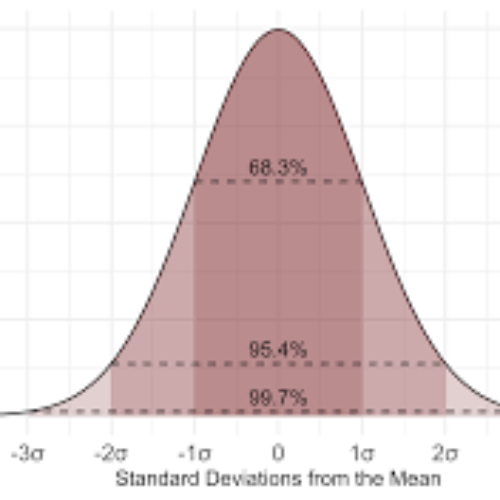
This activity sheet helps students better understand normal distributions through the use of dice. Each student rolls a pair of dice and adds the total of each dice and records it 100 times. Then they plot the distribution and in most cases, it comes out a bell curve. Its a fun and easy way to show the distribution. You could pair students up for less dice usage.
This activity sheet helps students better understand normal distributions through the use of dice. Each student rolls a pair of dice and adds the total of each dice and records it 100 times. Then they plot the distribution and in... more
0
Overall review score
Displaying All Reviews | 0 Reviews
0
0%
0
0%
0
0%
0
0%
0
0%
More from this shop

$1.50

$2.00

$2.00

$1.50
$1.50
$1.50

$1.50

$2.00

$2.00

$1.50
$1.50
$2.00

$1.50
$2.00

$1.00
Similar items

$3.00

$7.00

$6.50

$1.75

$5.00

$3.75

$4.00

$5.00
