


Details
Pages
6 Pages
Subject
Math, Math applications
Languages
English
Product
Digital
Grade
7th, 8th, 9th
Resource Type
Handouts, Homework, Worksheets
Standard
Common Core Mathematics Standards
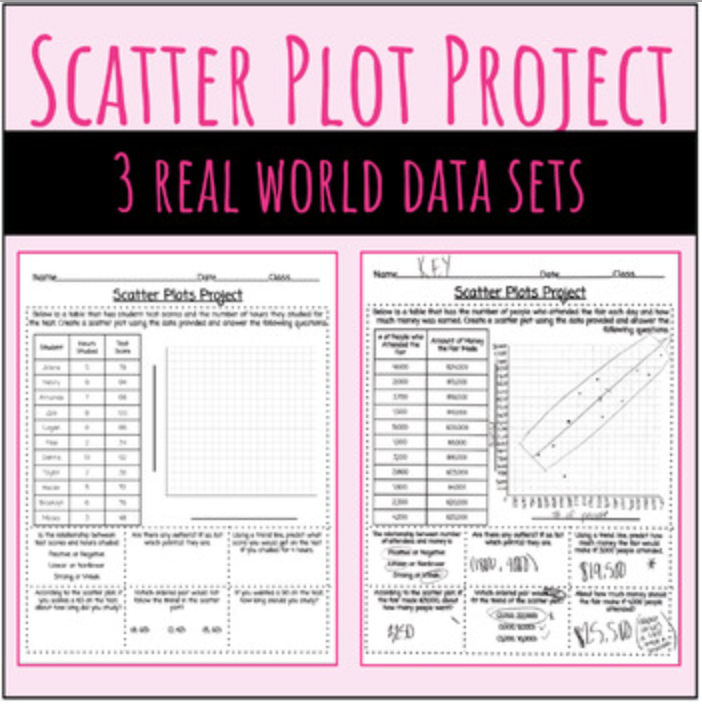
Description
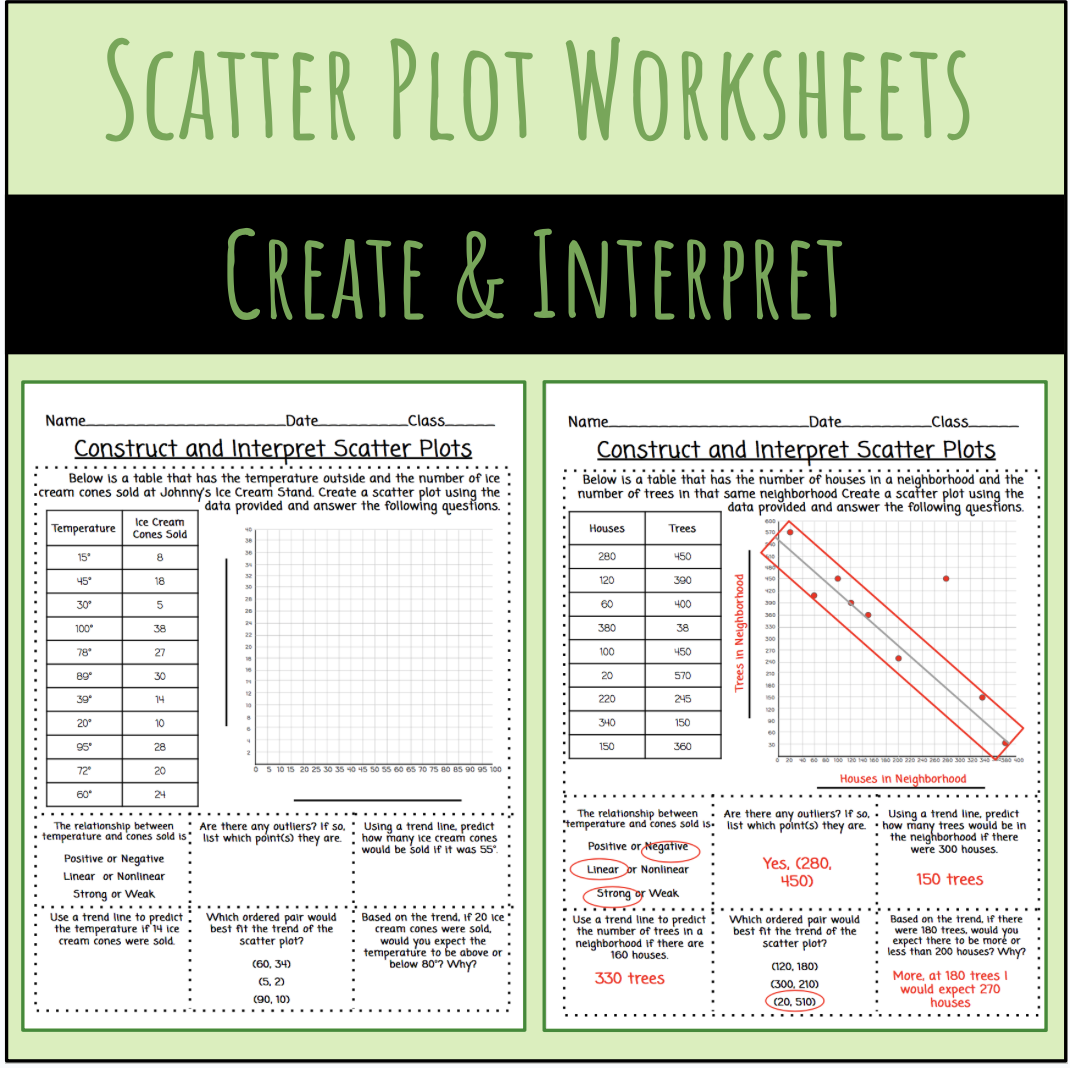
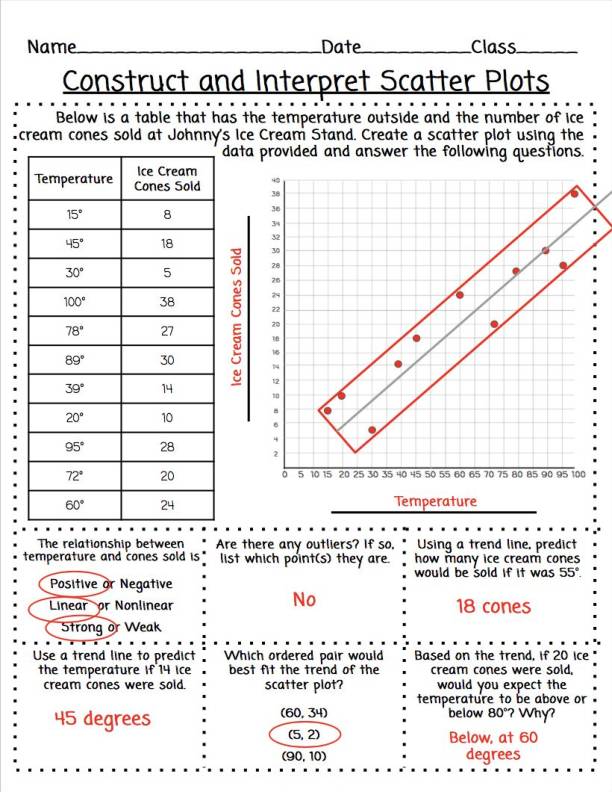
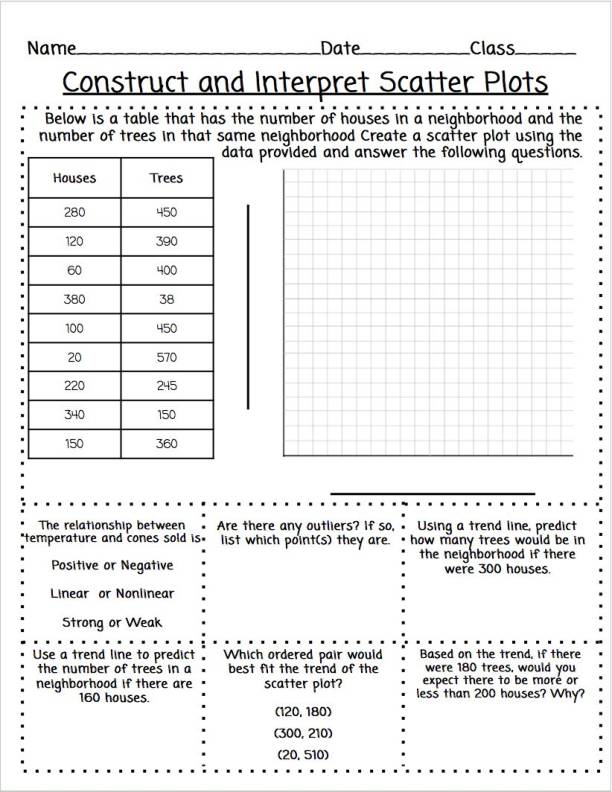
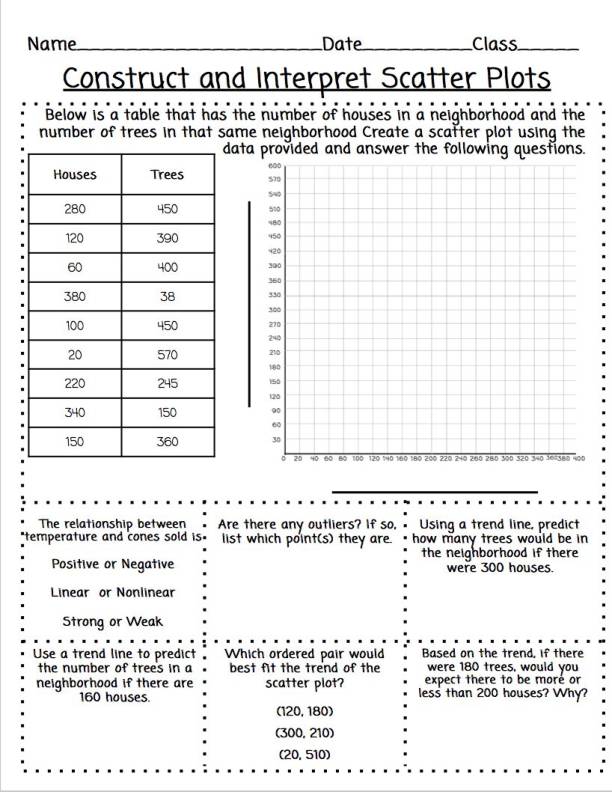
This PDF includes 2 Real World Scatter Plot Scenarios. Students must take the bivariate data, plot the data to construct/create the scatter plot, create/draw a trend line, use the trend line to make predictions and interpret the data in the scatter plot. Two variations of each Scenario are included.
For each scenario, you can choose to give you students the graph WITH the x and y axis values OR the worksheet that contains a completely blank graph, where students must determine the scale for each axis and what number they wish to count by.
Students will answer questions pertaining to the scatter plot strength, association, and correlation, determine if there are outliers, as well as make evidence based predictions and see which ordered pairs best fit the overall trend of the graph.
ALL keys are included.
This can be used as in class worksheet practice, substitute work, homework, or however you see best fit. :)
This PDF includes 2 Real World Scatter Plot Scenarios. Students must take the bivariate data, plot the data to construct/create the scatter plot, create/draw a trend line, use the trend line to make predictions and interpret the data in the... more

Reviews
More from this shop


Similar items


$16.35
$18.17
-10% Off